

Grateful Patient programs in hospitals are growing more now than ever. An Advisory Board survey of 108 hospitals found that more than half had Grateful Patient programs. These programs rely on a combination of technology, patient data and staff engagement to identify patients that could be prospective donors. While there are many theories as what the most successful path to large donations is, there is a common myth and an opportunity gap to uncovering more prospective donors.
#1 Myth of Donor Prospecting: Looking for “whales in disguise”
Many organizations believe that the fastest path to increasing donations is to uncover a previously unknown major donor or a “whale in disguise.” In fact, most transformative major gift donors are found through regular donor outreach and engagement; the ‘mega-gift’ comes from careful cultivation and attention from many stakeholders.
For example, imagine there are 100 patients standing in a line as they are leaving the hospital. Then, using every tool you have to figure out wealth, you carefully inspect each patient and then talk only to that one. While looking for that wealthy one in line, 27 others with the capacity and propensity to give would have gone undetected because only wealth indicators and not behavioral aspects were considered in the qualification process. As a result, there would be 27 missed opportunities for a “yes” to donating because they were screened on wealth alone and overlooked.
The Opportunity Gap
There are prospects who would respond if approached, but they are missed entirely within the current Grateful Patient wealth screening process. When adding in a layer of behavioral indicators to the traditional wealth screening process, more donors with a likelihood to give are identified. Even though it may not be the major gift donors, these prospective donors are greater in number and will donate in smaller amounts.
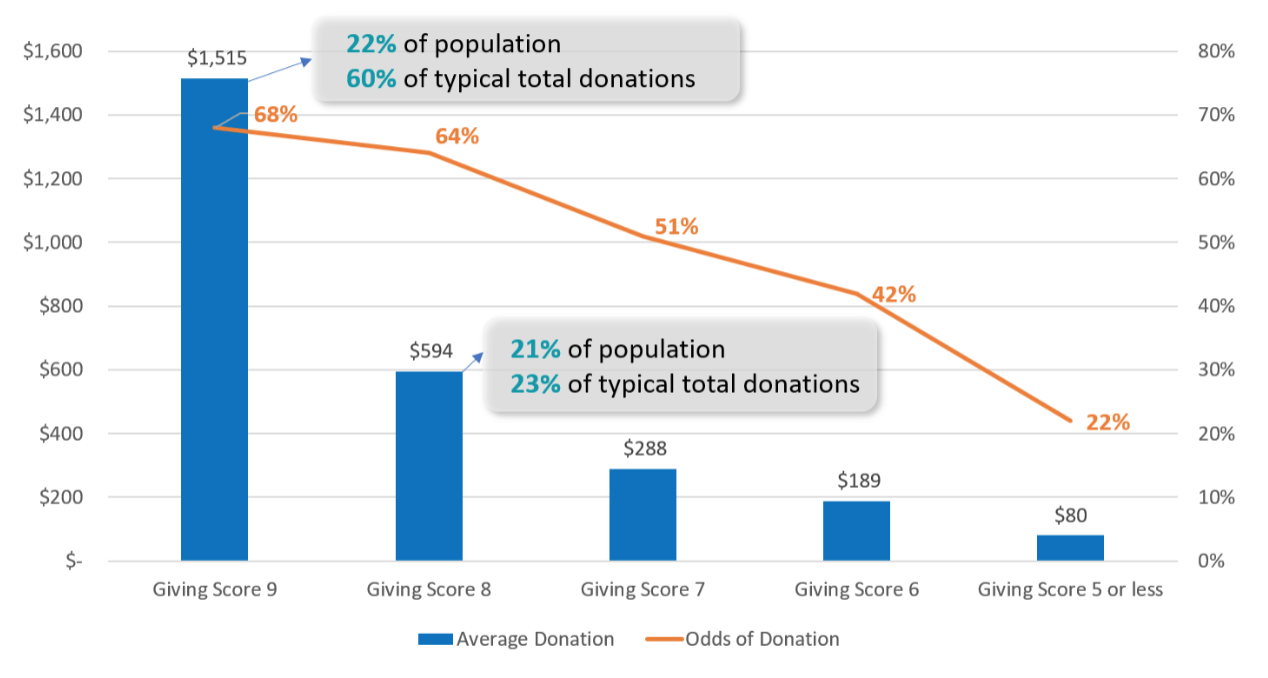
The chart below illustrates the immediate impact of the Brightway Giving Score. The blue columns represent the various segments that the Brightway Giving Score identifies. These segments show you the groups of prospects that have a likelihood and willingness to donate regardless of wealth. As the segments decrease in value, so does the likelihood of donation. The orange line represents the odds of donation which correlates to the segments. The first two columns with the callouts show you a little more into those segments which may be typically ignored when screening solely on wealth.
Everyone wants to go after the big whale donation but with stiff competition from other non-profit organizations going after the same people, a new group of donors needs to be identified even if their donations aren’t considered “major gifts.” Every little bit helps.
Recent Comments